Vehicle Retention Tracker

Turn Aftersales Data Into Revenue Growth

The ASAS Connect Retention Dashboard gives automotive businesses full visibility into who is coming back, who is lost, and exactly what to do about it, built on real service retention behaviour at VIN level.

Retention Dashboard
Live Data
Service Retention
48.0%
Car Parc 0–9Y
Car Parc
10,697
Total VINs
Customers Retained
5,138
Returning customers
Customers Lost
5,559
Lapsed customers
Retained vs Lost · by Vehicle Age
0–1Y
2–3Y
4–6Y
7–9Y
Retained Lost
Revenue-Focused Retention Intelligence

"See Who You're Losing.
Know Why. Win Them Back."

A dashboard built for automotive decision-makers, not analysts

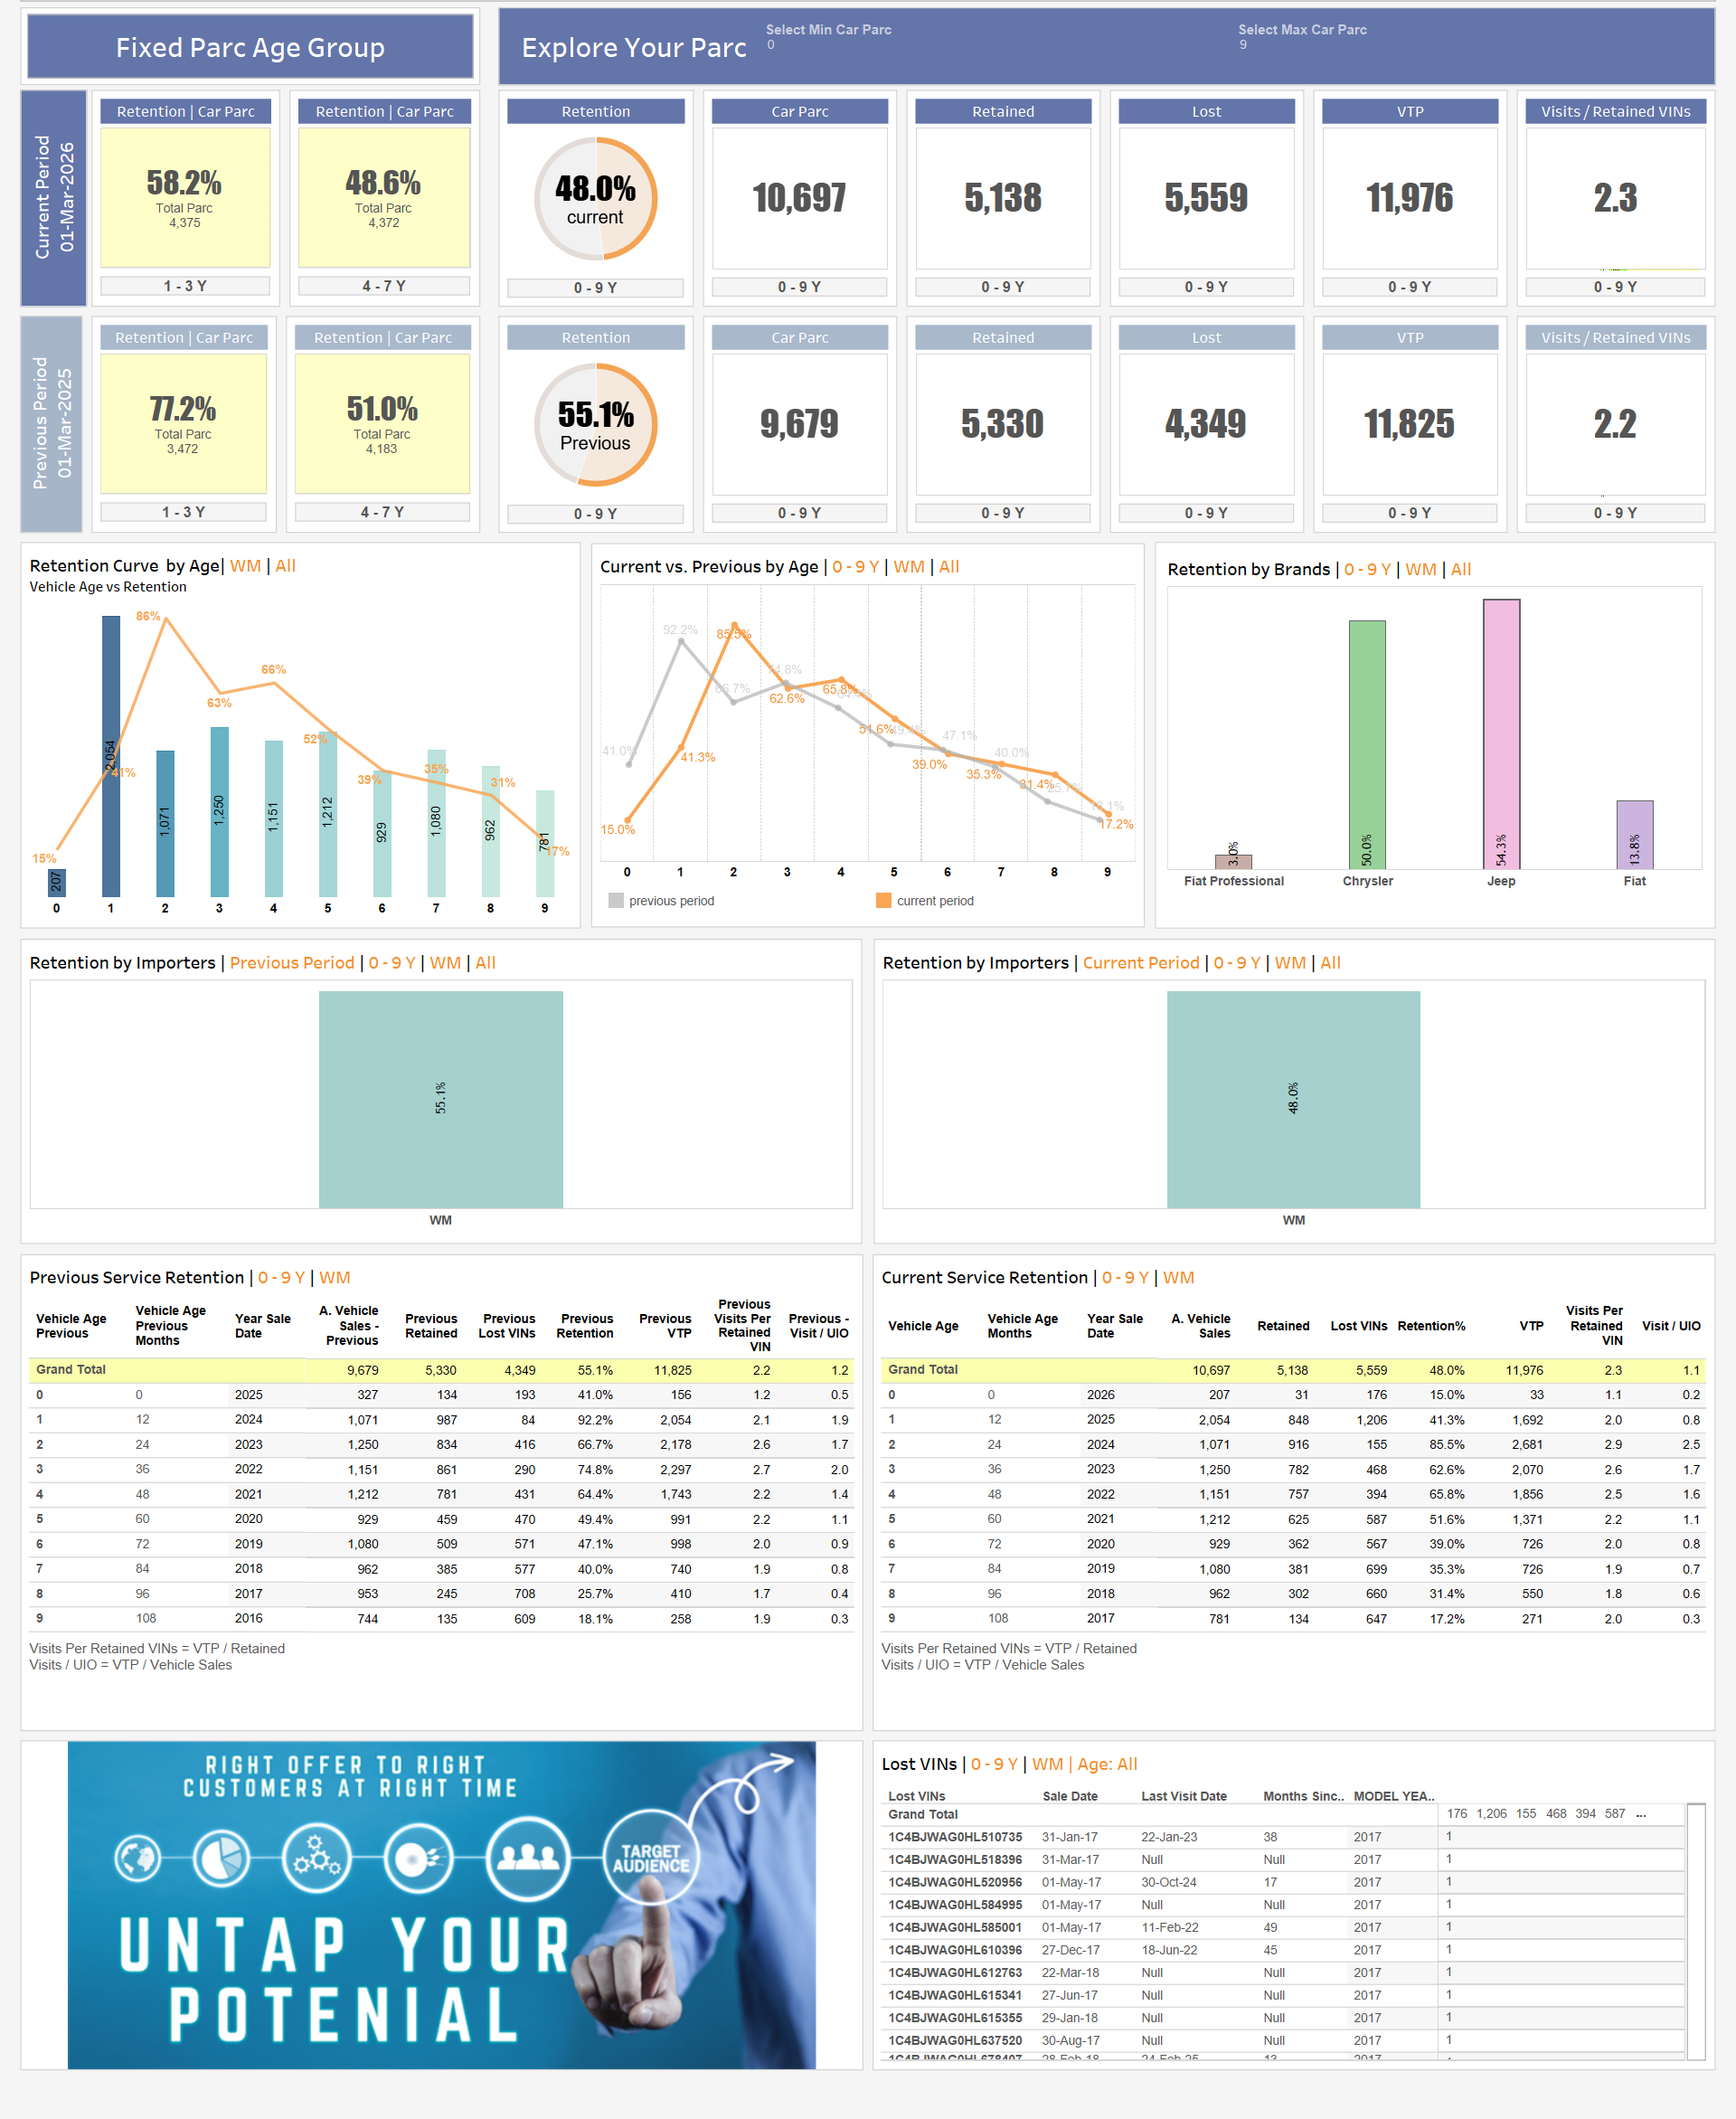
  • Know exactly which customers haven't returned, tracked at VIN level, not just totals
  • See retention trends by vehicle age, make, model, and importer, instantly
  • Track service visits, VTPs, and revenue potential in a single live view
ASAS Connect · Retention Dashboard
ASAS Connect Retention Dashboard
VIN-level
Customer Tracking
Every vehicle tracked individually, not aggregated
10
Dashboard Views
Pre-built capabilities covering the full retention picture
Daily
Live Data Refresh
Decisions made on yesterday's data, not last quarter's
Customizable
Vehicle Age Range
Full lifecycle coverage across every age band
The Challenge

Why Retention Data Is Impossible to Track Manually

Retention is not a snapshot, it's a rolling calculation that changes every day as vehicles are sold and customers visit workshops. Keeping it accurate without automation is a full-time job with no end.

WITHOUT ASAS CONNECT
Sold VINs Must Be Maintained Manually

Every new vehicle sold must be added to the car parc dataset. Miss one and your retention denominator is wrong, silently understating or overstating performance.

Car Parc Age Ranges Recalculate Constantly

Vehicles age every month. The 0–1, 1–3, 3–5 year bands shift continuously. Rebuilding these ranges by hand, for every brand, dealer, and period, requires hours of spreadsheet work.

Workshop Traffic Data Must Stay Current

Retention is only meaningful when matched against live visit data. Without a daily feed, any report is already out of date the moment it is produced.

Complex Calculations, Compounding Errors

Cross-referencing sold VINs, visit records, and age cohorts across multiple brands and periods is error-prone at every step. One wrong formula propagates across the entire report.

WITH ASAS CONNECT
Sold VINs Ingested Automatically

The ETL pipeline pulls sold vehicle data from your DMS daily, every new VIN enters the car parc the moment it is registered, with no manual action required.

Age Ranges Rebuilt on Every Refresh

Car parc age bands are recalculated at each data load. The dashboard always shows the current vehicle age distribution, no spreadsheet, no formula maintenance.

Workshop Visits Updated Daily

Visit records are matched to car parc VINs automatically. Retention % reflects what happened yesterday, not last month's export sitting in someone's inbox.

KPIs Calculated at the Engine Layer

Retention %, retained vs lost, VTP, and age-cohort curves are all computed by the data engine, not a person. Zero formula errors. Zero stale numbers. Always decision-ready.

Most automotive businesses know their retention is low, they just can't pinpoint where, when, or why, because the data to answer those questions is scattered, manual, and always out of date. ASAS Connect closes that gap entirely.

How It Works

The Data Pipeline Behind Real-Time Retention Tracking

Customer data flows from your importer systems through a secure ETL pipeline, into the ASAS central database, powering live retention dashboards inside ASAS Connect, refreshed every day.

01

Data Sources

Importers submit data via three flexible ingestion methods

Excel / CSV SFTP API / DMS
Ingest
02

ETL Engine

Extract, validate, transform and load, automated daily pipeline

Extract Validate Transform
Daily
03

ASAS Central Database

Processed data stored in a single, governed central repository

Central Repo Governed
Query
04

Tableau Analytics

Reads from the database and builds visual retention analytics

BI Engine Embedded
ASAS Connect

Embedded Analytics Platform

Retention dashboards surface directly inside ASAS Connect, giving your team a live, up-to-date view of customer retention metrics, churn risk scores, and engagement trends without leaving the platform.

Live Data Daily Refresh Customer Retention Dashboard
Data Integrity

100% Automated. Zero Human Manipulation.

Data flows directly from your DMS systems through the ETL pipeline into the central database, without a single human touching it at any stage. No manual entry. No editing. No filtering. What reaches the dashboard is exactly what happened in your business.

Fully Automated Pipeline

Data is extracted, validated, and loaded by the ETL engine on a daily schedule, no manual steps, no human uploads, no intervention of any kind between your DMS and the database.

Source-to-Dashboard Integrity

Every number on every dashboard is the exact number that came from the source system. Nothing is modified, adjusted, or filtered in transit, the data is locked from the moment it leaves the DMS.

True Business Performance

Because no one can touch the data, the dashboard reflects honest, unfiltered operational reality, not a curated version. Management sees the same numbers as field teams. No gaps, no surprises.

"The number you see is the number that happened ,
nothing more, nothing less."

This is what makes ASAS Connect a trusted accountability tool across the entire dealer network, from importers to OEM leadership. When every stakeholder is looking at the same unmanipulated data, performance conversations become honest, productive, and actionable.

Data Security

Every Stakeholder Sees Exactly What They Should

Access is governed at the database level, not filtered after the fact. Each user role connects to a scoped view of the data, so sensitive network metrics stay protected by design.

OEM / Global HQ
Global View
All Brands All Countries All Dealers Full KPIs

Complete network visibility across every brand, region, and dealer. Full benchmarking capability.

Regional Office
Regional View
Assigned Region Region Brands Region Dealers Regional KPIs

Full access within their assigned region. Cannot see data from other regions or global totals.

Hidden: Other regions · Global totals
Importer
Brand View
Their Brand Only Their Dealers Brand KPIs

Access scoped strictly to their brand and dealer network. No cross-brand visibility.

Hidden: Other brands · Regional totals · Network KPIs

Access is enforced at the database layer, not the dashboard layer. Users cannot view data outside their assigned scope, regardless of how they access the system. Role boundaries are set by the administrator and cannot be bypassed at the dashboard level.

Dashboard Capabilities

10 Capabilities That Make This Dashboard Powerful

Every feature surfaces actionable intelligence, not just data, so your team can act fast without relying on analysts.

01, RETENTION VISIBILITY

Real Retention Visibility

Track true retention based on actual workshop visits vs vehicle parc, Retention %, Retained vs Lost, and total active car parc. Instantly know if your strategy is working and where revenue is leaking before it's too late.

Retention % Car Parc Tracking Retained vs Lost
02, AGE-BASED STRATEGY

Age-Based Retention Strategy

See the full retention curve by vehicle age (0–9 years) and identify exactly when customers stop returning. Target the right age cohort at the right moment, before they churn, not after.

0–9 Year Curve Drop-off Points Lifecycle View
03, PERIOD COMPARISON

Current vs Previous Performance

Compare retention %, retained vs lost evolution, and traffic trends side by side across any two periods. Measure whether your interventions are working and prove ROI to senior stakeholders with hard numbers.

Period Comparison YoY Trends ROI Proof
04, NETWORK INTELLIGENCE

Brand & Network-Level Insights

Break down retention performance across brands, importers, and dealers in a single view. Pinpoint top performers, identify who needs intervention, and replicate winning strategies across your network.

Brand Breakdown Dealer Ranking Importer View
05, WIN-BACK INTELLIGENCE

Lost Customer Identification

Pinpoint exactly who you lost, VIN-level lists with last visit dates and months inactive. Stop guessing and start targeting. Hand your CRM team a precision list ready for campaign activation today.

VIN-Level Lists Last Visit Date Months Inactive
06, WORKSHOP REVENUE

Workshop Traffic Intelligence

Measure workshop performance through VTP (Visits to Paid Operations) and visits per retained VIN. Connect retention metrics directly to workshop revenue so you know which retention actions actually drive income.

VTP Metric Visits per VIN Revenue Link
07, CAR PARC FILTERING

Car Parc Exploration & Filtering

Filter your entire vehicle parc by age, model, or activity status. Use VIN exclusion logic to remove irrelevant entries and hand your team a clean, targeted list, ready for campaign activation with zero wasted outreach.

Age Filters VIN Exclusion Targeted Lists
08, REVENUE OPPORTUNITIES

Aftersales Opportunity Detection

Spot revenue opportunities the moment they appear, customers overdue for service, low-visit segments, and high-value inactives. Turn every insight into a campaign that drives workshop traffic and increases spend per customer.

Overdue Customers Low Visit Segments Upsell Ready
09, DECISION METRICS

Actionable KPIs at a Glance

All critical metrics in one view: Retention %, car parc size, retained vs lost VINs, VTP, and visits per retained customer. Everything a manager or director needs to make a decision, no analyst required.

All KPIs in One View No Analysis Needed Decision Ready
10, BUSINESS-READY

Built for Business Users

Intuitive layout with drill-down capability and interactive filters by country, brand, company, and vehicle age. No training, no IT dependency, your team is productive from day one.

No IT Required Drill-Down Country/Brand Filters
Implementation

Up and Running in Weeks, Not Months

TechnoSignage manages the full implementation lifecycle, from data integration to dealer network training. Your team focuses on the insights. We handle everything else.

01

Connect

We integrate your dealer data sources, via manual upload, SFTP, or direct DMS connection, whichever fits your network.

02

Configure

Dashboard customised to your brand hierarchy, regional structure, KPI definitions, and user access tiers.

03

Launch

Dealer network trained, users onboarded, and your team is live, with full TechnoSignage support throughout.

Data Integration

Manual Upload

Excel / CSV templates submitted via web portal or email. Zero technical setup required on the dealer side.

SFTP Channel

Scheduled automated file delivery. Dealers drop files; the pipeline picks them up and processes automatically.

DMS Direct Integration

API connection into the Dealer Management System. Fully automated, data flows without anyone touching it.

Dashboard & Hosting

Custom Configuration

Dashboard built to your brand hierarchy, regional structure, and KPI definitions from day one.

Managed Cloud Hosting

No servers to provision or maintain. TechnoSignage operates the full infrastructure and daily pipeline refresh.

User Access Provisioning

Role-based access configured to your org structure. Users see exactly what they should from day one.

Dealer Network Onboarding

Training Programme

Structured training for dealer data coordinators covering upload procedures, data quality standards, and troubleshooting.

Guided First-Cycle Upload

TechnoSignage walks each dealer through their first data submission, ensuring clean data from the start.

Ongoing Network Support

Dedicated helpdesk for network queries, data anomaly alerts, and pipeline issue resolution throughout the contract.

"From raw dealer data to live board-level dashboards, typically in 4–8 weeks."
  • Integration setup and pipeline testing
  • Dashboard configuration and UAT
  • User provisioning and access setup
  • Dealer network training and first-cycle support

See who you're losing. Win them back.

Book a demo of the ASAS Connect Retention Dashboard and discover exactly where your aftersales revenue is leaking, and how to recover it.