When a dealer, country office, and regional HQ each report a different number for the same month, the dashboard is usually where the disagreement becomes visible. The cause is often earlier in the chain: different source coverage, reporting periods, definitions, or corrections. Reconciling the figures means tracing one disputed measure back through those decisions, not choosing the most attractive total.
For a regional COO, aftersales leader, or finance team, the practical question is: which number can we explain to HQ, and what is still missing? The method below starts with that question.
Why do dealer and regional reports disagree?
1. The source files cover different dealers or dates
One country may have received every dealer file before the reporting cut-off; another may still be waiting for a late submission. A regional pack assembled from last week's extract will not match a dealer report refreshed this morning. Record the source, file version, arrival time, reporting period, and included dealer list for every total.
2. The KPI has more than one definition
“Service revenue” can mean invoiced work, posted accounting revenue, customer-paid work only, or a figure that includes warranty. It may be shown before or after returns, tax, or currency conversion. These are different measures until the business owners approve one definition for the report. The KPI needs a written rule and a named owner.
3. Dealer systems do not describe data the same way
Different dealer management systems and exports can use different codes, field names, and levels of detail. A regional model needs agreed mappings and validation rules so a local transaction lands in the correct common category. A missing or unmapped code should become a visible exception, not disappear into an “other” total.
4. Manual corrections are hard to trace
A spreadsheet adjustment may be legitimate, but it must carry the original value, reason, approver, and effective period. If the dealer corrects a source file after the country team has sent its pack, both versions need to remain identifiable. Otherwise the same monthly figure changes without an explanation.
Start with one disputed figure
Consider an illustrative month-end service revenue difference. The dealer report uses invoice date and includes warranty work. The HQ pack uses posting date, excludes warranty, converts currency at a different rate, and was prepared before one dealer's late file arrived. Neither total can be reconciled until these choices are made explicit.
- Fix the comparison point. Write down the metric, period, currency, dealer scope, and the two report versions being compared.
- Confirm the business rule. Have finance and aftersales owners agree which transactions count and which date drives the period.
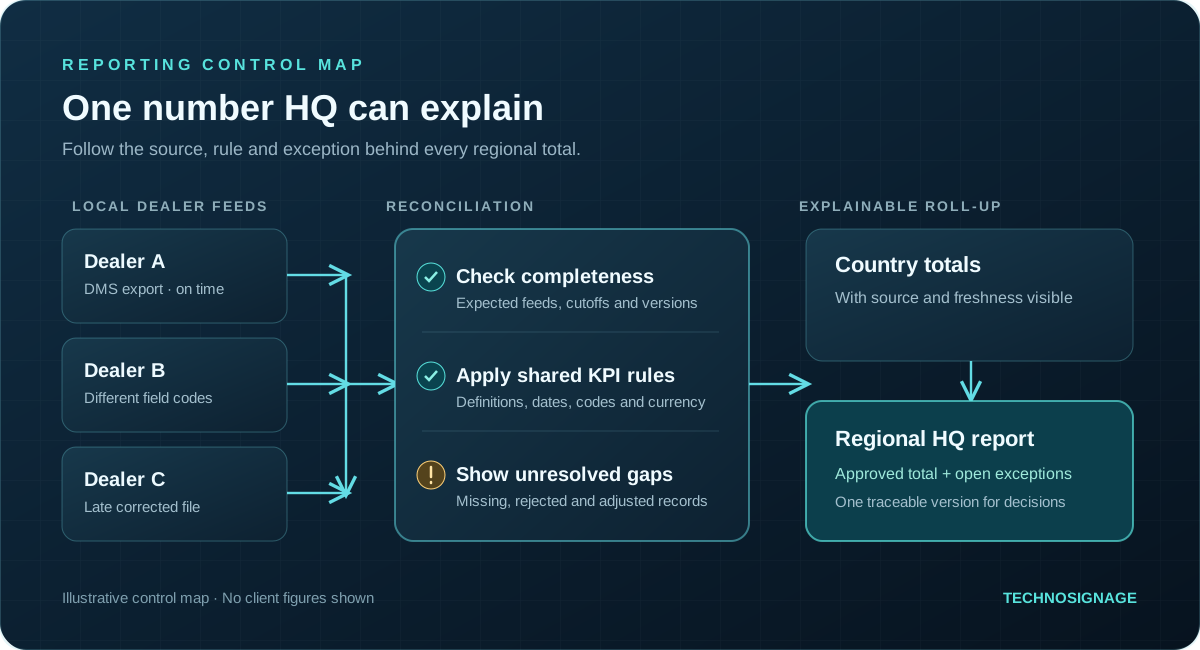
- Check completeness. List every expected dealer feed and mark received, late, rejected, corrected, or not applicable.
- Trace the roll-up. Compare source totals with validated dealer totals, country totals, and the regional figure. Keep differences visible at each level.
- Publish the explanation. Give HQ the approved definition, data freshness, outstanding exceptions, and owner for each unresolved gap alongside the number.
This creates a repeatable control. The aim is not to force two differently defined reports to match; it is to give every audience a figure whose origin and limits they can understand.
What a real multi-country reporting workflow looked like
In a regional automotive deployment, TechnoSignage built custom business-user tools, a built-in ETL layer, and Tableau dashboards for a dealer network spanning multiple countries. This description leaves out client data, source-specific mappings, and KPI values. It describes the documented delivery architecture; the service revenue example above is illustrative.
- Collect: dealers transferred scheduled operational files through secure SFTP connections, accommodating different local systems.
- Validate and standardise: the ETL layer checked incoming structure and quality, flagged anomalies, and transformed fields into a common model.
- Refresh: integrated Tableau dashboards drew on that model daily rather than waiting for separate manual report compilation.
- Scope access: users saw the dashboards and dealer, country, brand, or regional data appropriate to their roles.
The architecture does not remove the need for finance and operational owners to agree on KPI definitions. It gives those rules a consistent path from dealer data to regional reporting. See the published Stellantis Middle East case study for the named deployment, its scope, and its public outcome claims.
What should a reporting assessment produce?
Start with one report that is late, disputed, or manually consolidated. A useful assessment should identify its source systems and owners, document the current KPI rules, show where data is missing or corrected, and propose a phased integration and reporting approach. That is enough to define a project around the actual network rather than around a generic dashboard count.
If your regional office has to consolidate dealer results for HQ, explore our dealer network reporting approach. You can request a dealer reporting assessment conversation with the report and the conflicting figures you want to investigate.