Fragmented information
Order intake, warehouse activities, invoices, shipments, and outstanding orders are spread across separate reports and departments.
Connecting enterprise data, automated workflows, and interactive dashboards to give business teams consistent daily operational visibility.
Enterprise organizations generate enormous amounts of operational data, yet valuable information often remains scattered across ERP systems, emails, spreadsheets, and disconnected reports.
TechnoSignage implemented an end-to-end automated reporting solution for a major automotive manufacturer, connecting enterprise-generated reports with automated workflows, centralized processing, and interactive business intelligence dashboards.
The result is a streamlined environment for daily visibility into order management, warehouse operations, and supply chain performance.
Explore our business intelligence consulting in Dubai and the UAE for support with your own reporting requirements.
The challenge was transforming existing enterprise data into accessible, consistent, and actionable information, while minimizing manual intervention.
Order intake, warehouse activities, invoices, shipments, and outstanding orders are spread across separate reports and departments.
Collecting, renaming, transferring, and consolidating files adds recurring work before analysis can begin.
Different stages of the order lifecycle are difficult to review through one reporting interface.
Business users depend on recurring preparation activities before updated information becomes available.
Reviewing backorders, fulfillment activities, and future demand requires combining multiple datasets.
Microsoft Power Automate, data integration, and automated ETL work together to move SAP reports into a centralized reporting environment. This reporting automation establishes the data foundation for daily supply chain analytics.
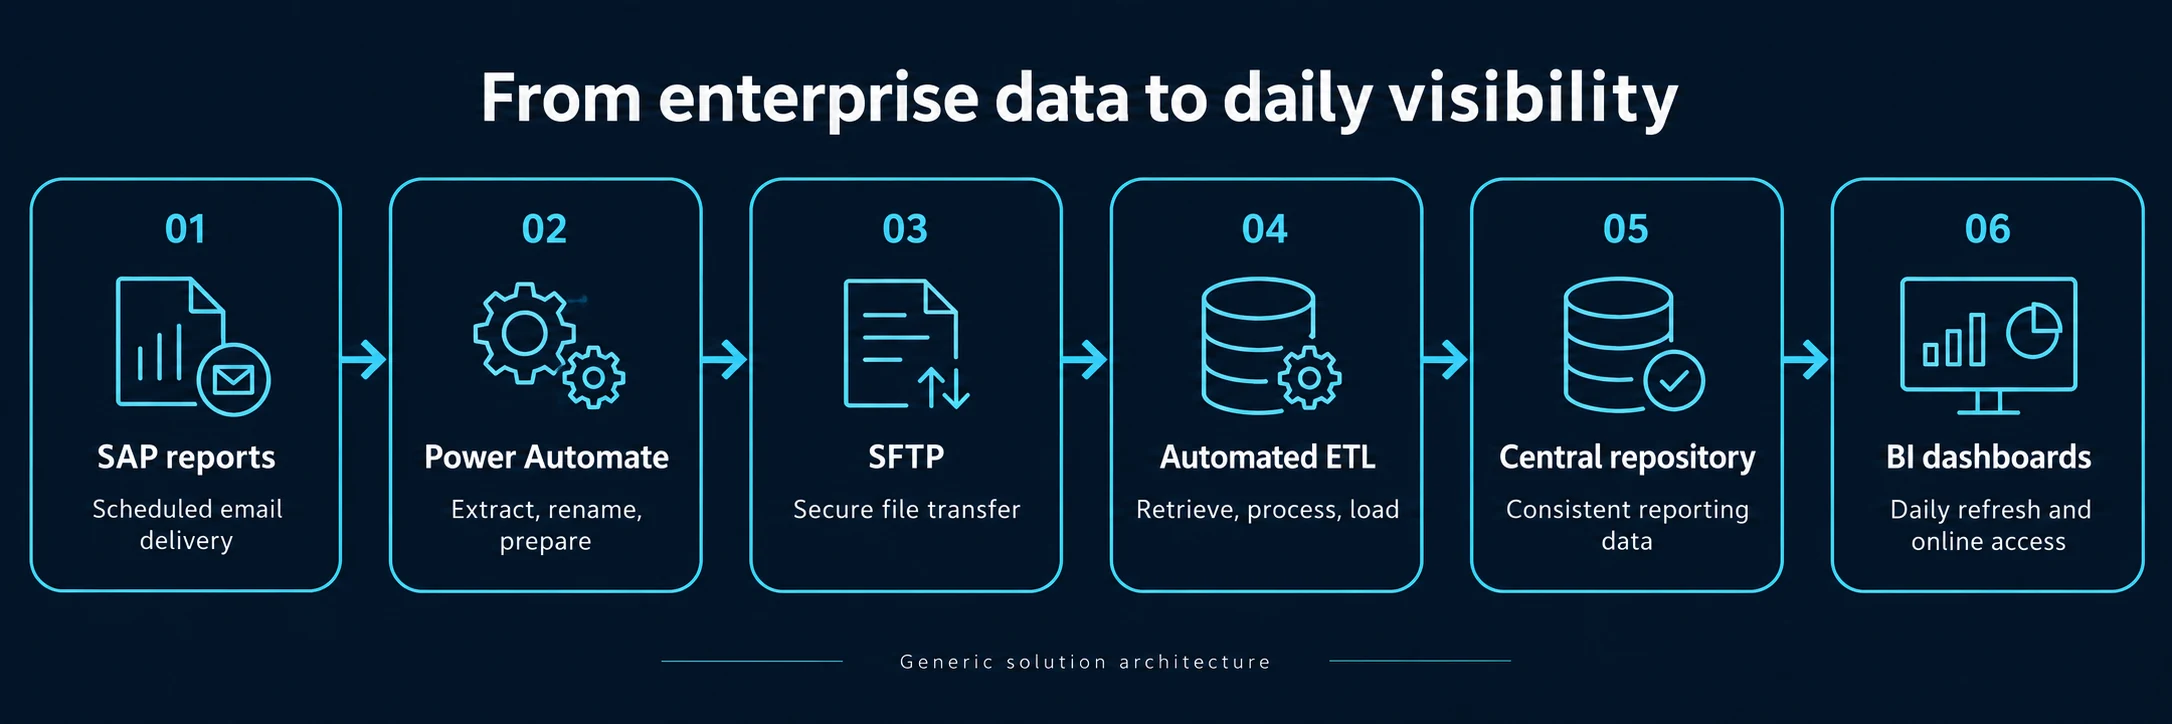
SAP generates scheduled operational reports for warehouse activities, order intake, invoicing, backorders, and future orders, then distributes them by email.
Microsoft Power Automate monitors a designated inbox, identifies report emails, retrieves attachments, renames files using predefined conventions, and prepares and transfers them to SFTP.
SFTP provides a structured file exchange mechanism between the automated workflow and the data integration environment.
The integration process retrieves the reporting files, processes incoming information, and loads the data into a centralized repository.
The reporting platform brings the processed operational datasets together in a unified environment for dashboard analysis.
Dashboards refresh daily so authorized business users can access updated operational information online. Normal daily processing runs automatically.
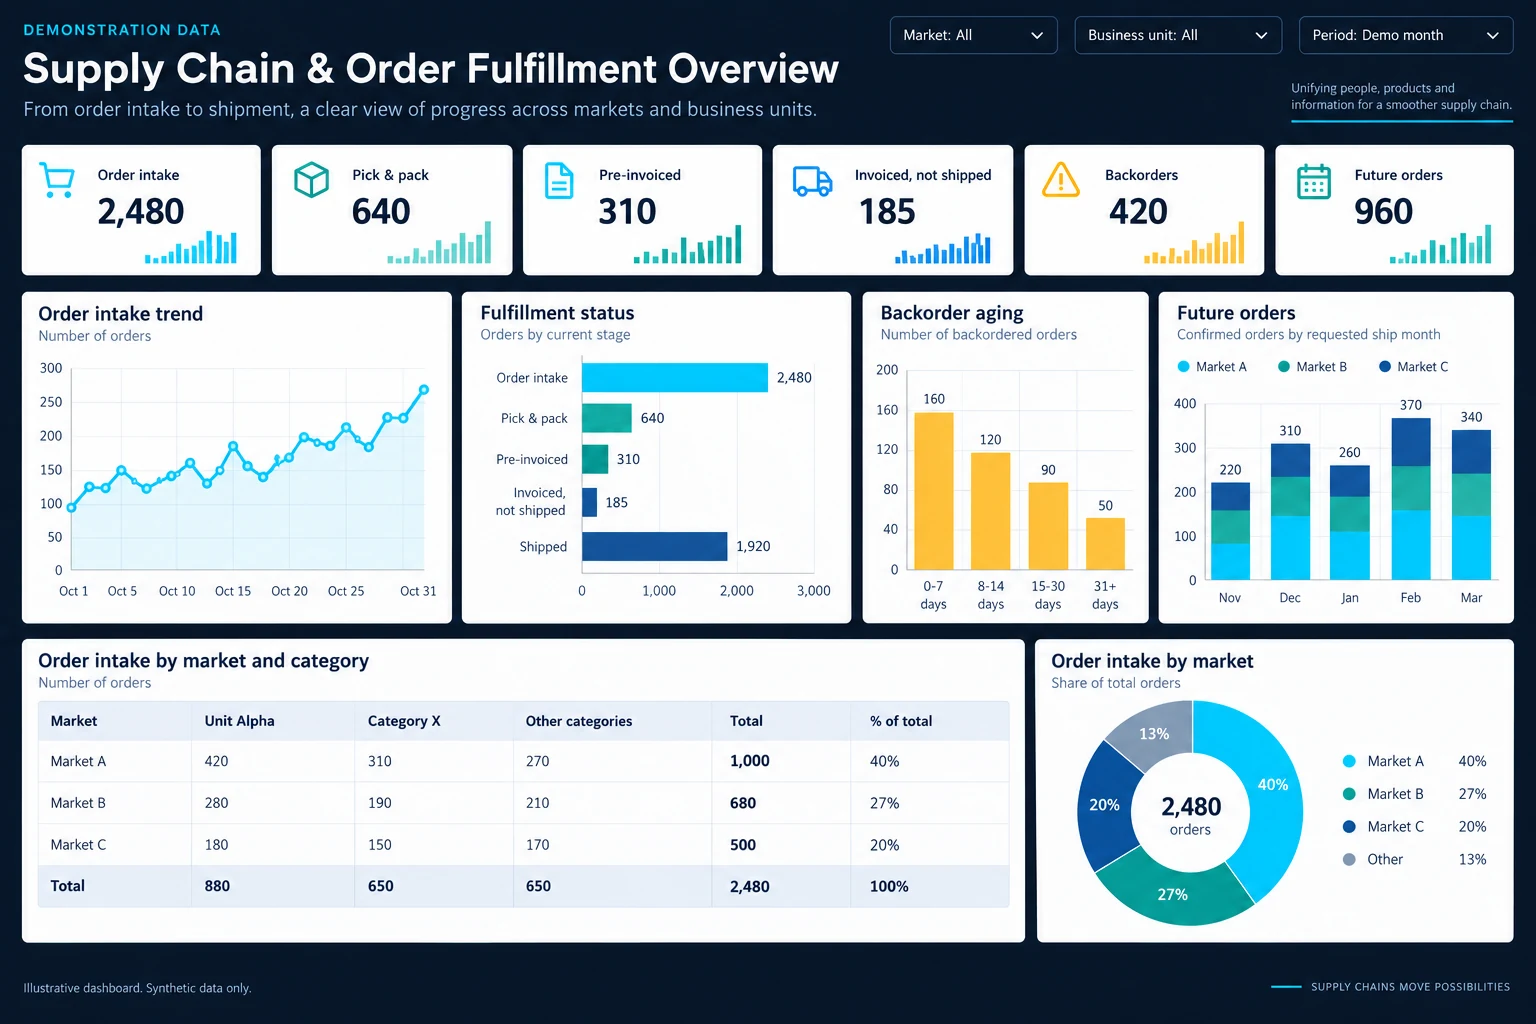
The supply chain dashboard brings order intake, fulfillment status, and outstanding demand together. Warehouse dashboard views help teams monitor pick and pack activities, while backorder aging and future orders support operational review and planning.
Monitor incoming orders and demand patterns across periods, business segments, and markets.
Review orders progressing through warehouse picking and packing activities.
Monitor orders that have reached the pre-invoicing stage.
Identify invoiced orders that remain outstanding for shipment.
Analyze outstanding backorders across available aging categories.
Review upcoming orders and known future demand across reporting periods.
Depending on the underlying dataset, dashboard users can analyze information through filters such as:
A practical change in how reporting data is collected, prepared, and accessed, with business value built into the daily workflow.
Scheduled files move through the integration process without manual downloading, renaming, uploading, and consolidation during normal operations.
Business teams access multiple operational indicators through one reporting environment.
Automated processing and scheduled dashboard refreshes establish a predictable reporting cycle.
Authorized users access dashboards online and explore relevant information using interactive filters.
Consolidated dashboards help teams review order activity, fulfillment stages, backorders, and future demand.
The approach can be adapted to additional reporting requirements, data sources, and business processes.
This implementation focused on supply chain and warehouse operations. The same architecture can be adapted to other industries, existing systems, and reporting objectives.
Logistics analytics for shipment status, outstanding deliveries, and operational performance
Manufacturing analytics for production reporting, material availability, and order fulfillment
Retail analytics for sales consolidation, inventory reporting, and branch performance
Order intake, backorders, stock availability, and fulfillment reporting
Financial reporting automation, invoice monitoring, and data consolidation
Procurement analytics for purchase orders, supplier reporting, and outstanding deliveries
Parts distribution, warehouse operations, and order management
Potential applications, tailored to each organization's requirements.
At TechnoSignage, business intelligence extends beyond visual reports. We connect existing systems, automate repetitive data handling, and turn operational information into accessible insights.
Interactive dashboards, KPI monitoring, operational reporting, and management analytics.
Automated extraction, transformation, loading, and consolidation across enterprise systems.
Microsoft Power Automate consulting and workflow implementation to automate repetitive data-handling activities.
Centralized reporting environments tailored to business processes and operational requirements.
Technology-flexible solutions designed to work within your existing infrastructure.
Your organization may already have the information it needs. Let us discuss how to automate SAP reporting, connect systems, reduce repetitive Excel processes, and make operational insights accessible.