Find Aftersales Retention Gaps At VIN Level
A configurable ASASConnect dashboard for OEM, distributor, and dealer teams that need to identify retained, at-risk, and lost service customers, then prioritise the revenue opportunities behind them.
Why Retention Data Is Impossible to Track Manually
Retention is not a snapshot, it's a rolling calculation that changes every day as vehicles are sold and customers visit workshops. Keeping it accurate without automation is a full-time job with no end.
Every new vehicle sold must be added to the car parc dataset. Miss one and your retention denominator is wrong, silently understating or overstating performance.
Vehicles age every month. The 0–1, 1–3, 3–5 year bands shift continuously. Rebuilding these ranges by hand, for every brand, dealer, and period, requires hours of spreadsheet work.
Retention is only meaningful when matched against live visit data. Without a daily feed, any report is already out of date the moment it is produced.
Cross-referencing sold VINs, visit records, and age cohorts across multiple brands and periods is error-prone at every step. One wrong formula propagates across the entire report.
A configured pipeline can bring sold-vehicle data from your DMS into the car parc on the agreed refresh cycle, with validation rules for new and changed VIN records.
Car parc age bands are recalculated at each data load. The dashboard always shows the current vehicle age distribution, no spreadsheet, no formula maintenance.
Visit records are matched to car parc VINs automatically. Retention % reflects what happened yesterday, not last month's export sitting in someone's inbox.
Retention %, retained vs lost, VTP, and age-cohort curves are all computed by the data engine, not a person. Zero formula errors. Zero stale numbers. Always decision-ready.
Most automotive businesses know their retention is low, they just can't pinpoint where, when, or why, because the data to answer those questions is scattered, manual, and always out of date. ASASConnect closes that gap entirely.
The Data Pipeline Behind Real-Time Retention Tracking
Customer data can flow from approved importer and dealer sources through a secure ETL pipeline into the ASAS data layer, powering governed retention views on an agreed refresh schedule.
Data Sources
Importers submit data via three flexible ingestion methods
ETL Engine
Extract, validate, transform, and load on a configured schedule
ASAS Central Database
Processed data stored in a single, governed central repository
Tableau Analytics
Reads from the database and builds visual retention analytics
Embedded Analytics Platform
Retention dashboards surface inside ASASConnect, giving teams one governed view of retention metrics, churn indicators, and engagement trends based on the latest completed refresh.
Automated Processing. Controlled Exceptions.
Where source systems allow, scheduled integrations move data through documented validation and transformation rules into the reporting layer. Exceptions can be surfaced for review instead of being silently hidden or manually overwritten.
Configurable Data Pipeline
Data can be extracted, validated, and loaded on an agreed schedule through direct integration, SFTP, or controlled file upload, depending on each source system.
Source-to-Dashboard Integrity
Source fields, business rules, exclusions, and calculated metrics are documented so teams can trace how operational records become management indicators.
Governed Business Definitions
Retention windows, vehicle-age bands, exclusions, and ownership rules are agreed before launch so management and field teams interpret the same KPI consistently.
Every retention number should have a traceable definition and a visible source.
The scoped solution is designed to give importers, dealers, and OEM leadership one governed view while preserving the validation, exclusions, and access controls needed for trustworthy decisions.
Every Stakeholder Sees Exactly What They Should
Access is governed at the database level, not filtered after the fact. Each user role connects to a scoped view of the data, so sensitive network metrics stay protected by design.
Complete network visibility across every brand, region, and dealer. Full benchmarking capability.
Full access within their assigned region. Cannot see data from other regions or global totals.
Access scoped strictly to their brand and dealer network. No cross-brand visibility.
Access is enforced at the database layer, not the dashboard layer. Users cannot view data outside their assigned scope, regardless of how they access the system. Role boundaries are set by the administrator and cannot be bypassed at the dashboard level.
10 Capabilities That Make This Dashboard Powerful
Every feature surfaces actionable intelligence, not just data, so your team can act fast without relying on analysts.
Real Retention Visibility
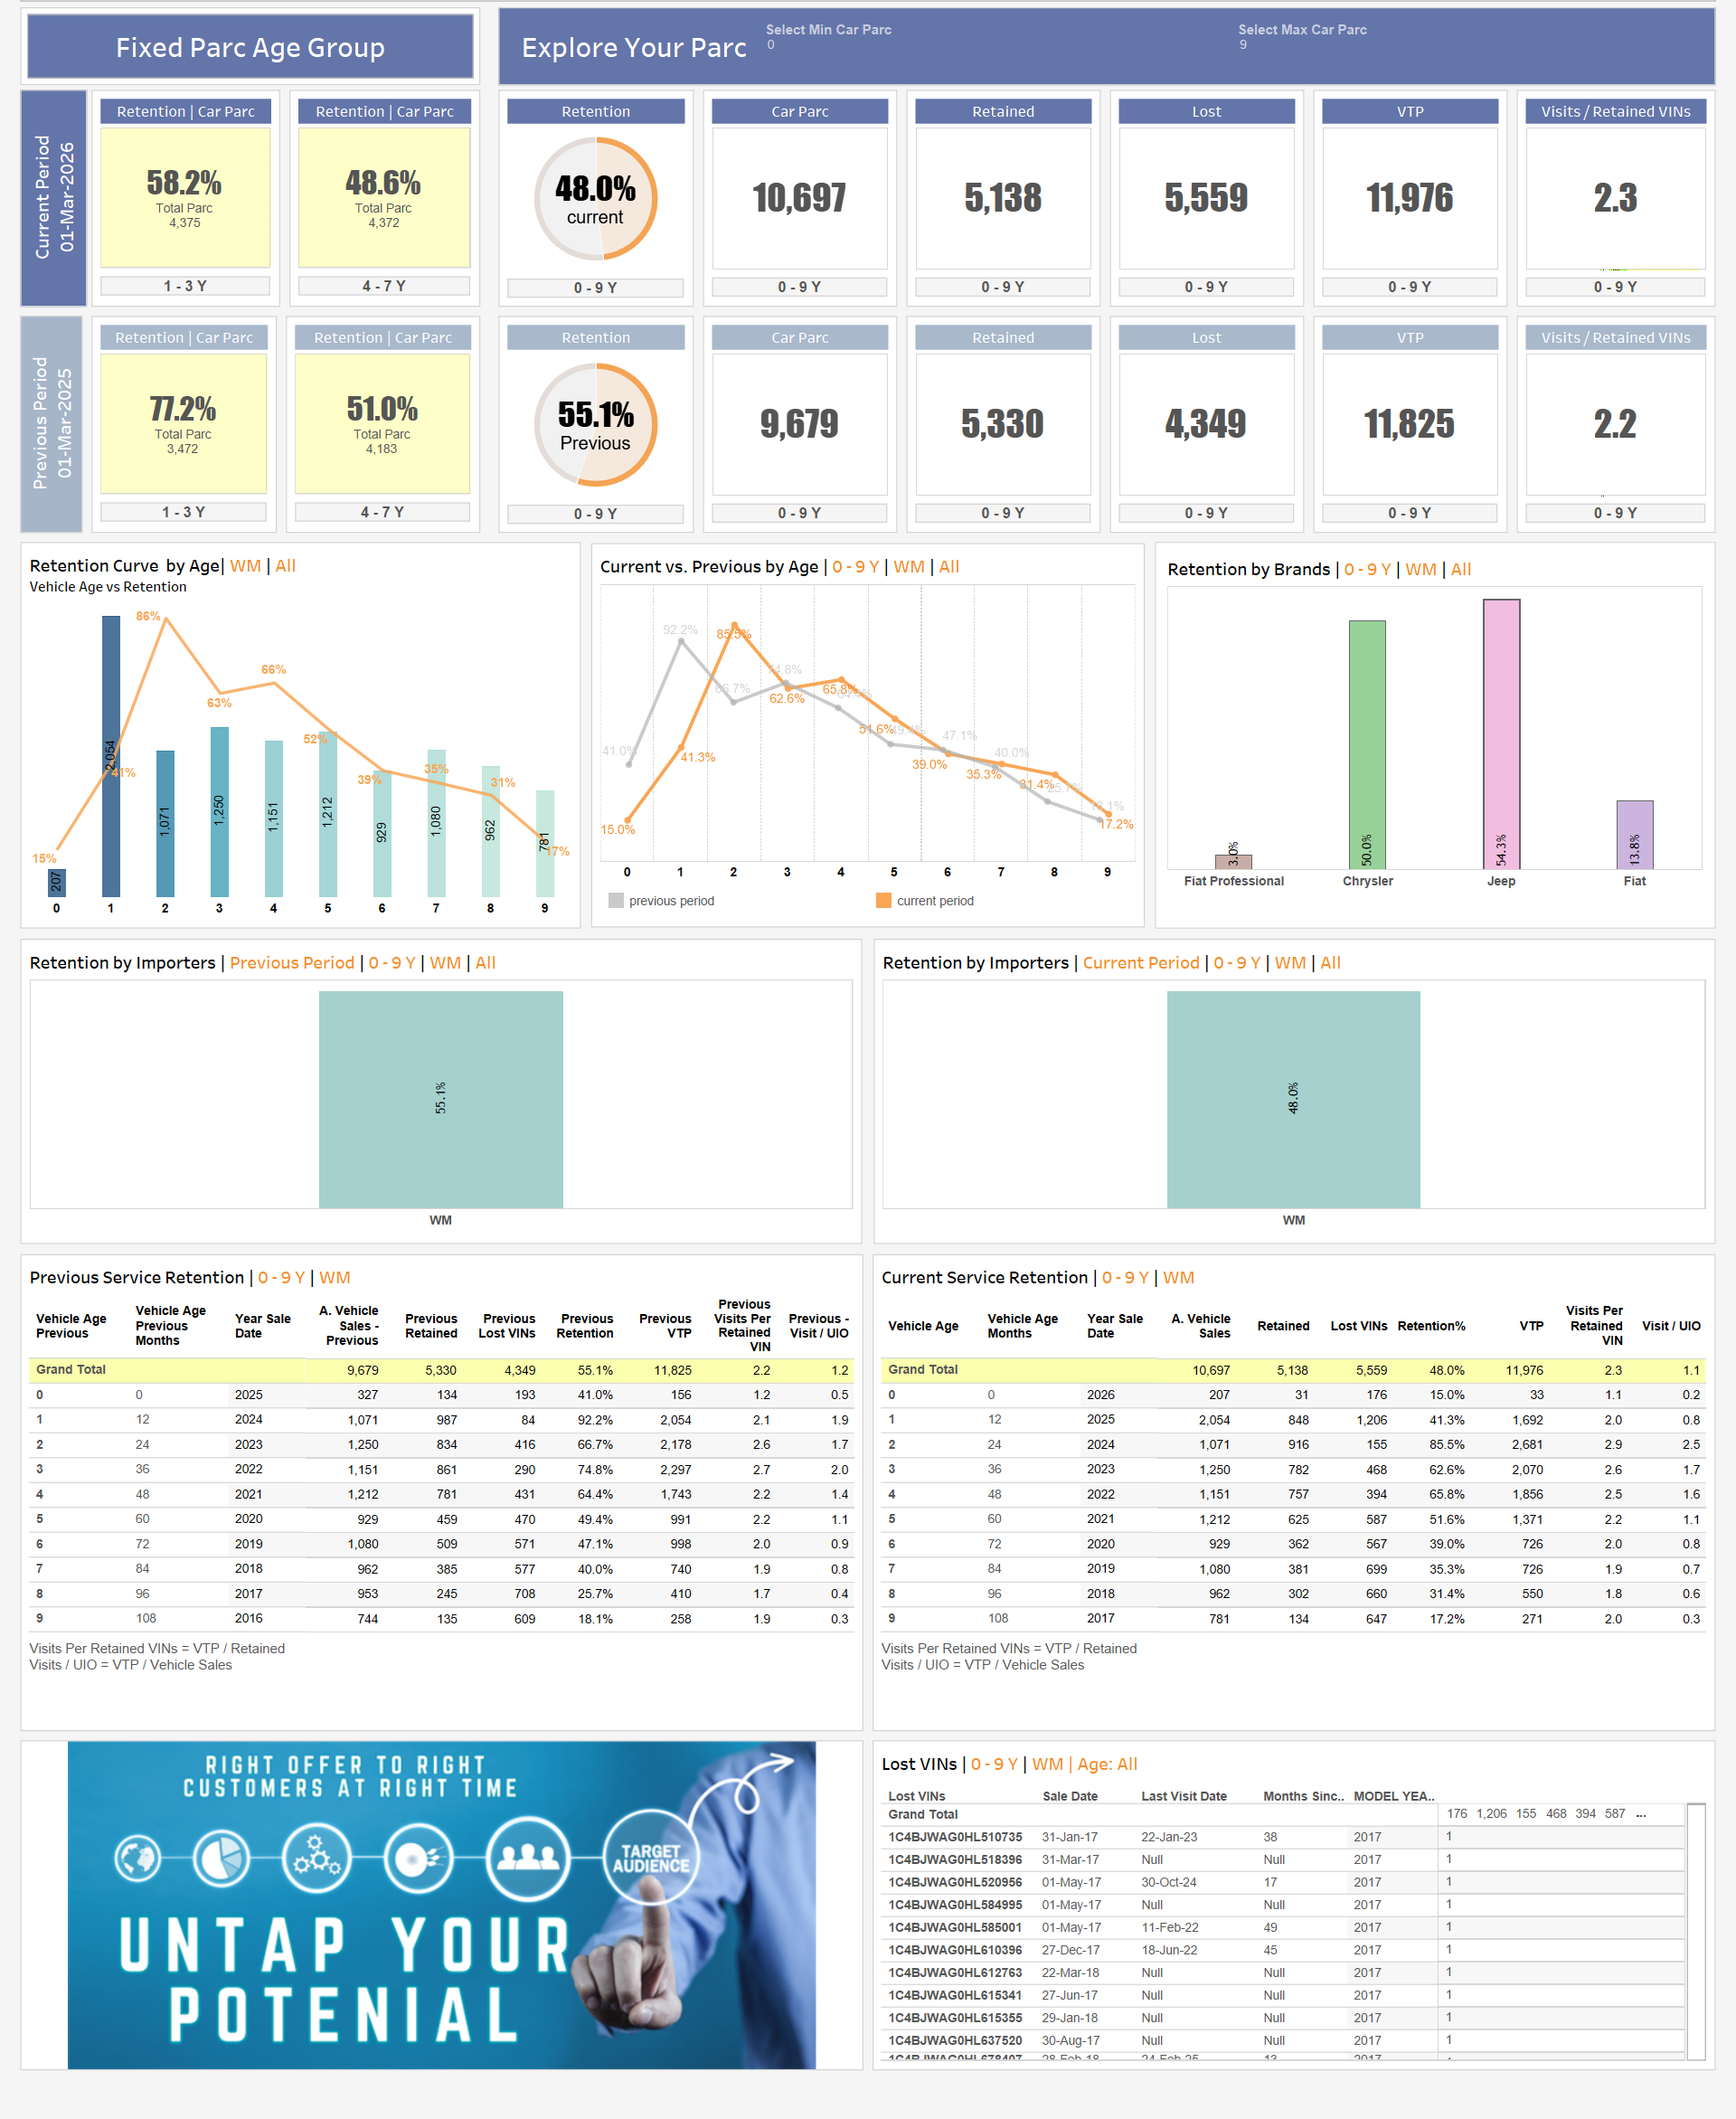
Track true retention based on actual workshop visits vs vehicle parc, Retention %, Retained vs Lost, and total active car parc. Instantly know if your strategy is working and where revenue is leaking before it's too late.
Age-Based Retention Strategy
See the full retention curve by vehicle age (0–9 years) and identify exactly when customers stop returning. Target the right age cohort at the right moment, before they churn, not after.
Current vs Previous Performance
Compare retention %, retained vs lost evolution, and traffic trends side by side across any two periods. Measure whether your interventions are working and prove ROI to senior stakeholders with hard numbers.
Brand & Network-Level Insights
Break down retention performance across brands, importers, and dealers in a single view. Pinpoint top performers, identify who needs intervention, and replicate winning strategies across your network.
Lost Customer Identification
Pinpoint exactly who you lost, VIN-level lists with last visit dates and months inactive. Stop guessing and start targeting. Hand your CRM team a precision list ready for campaign activation today.
Workshop Traffic Intelligence
Measure workshop performance through VTP (Visits to Paid Operations) and visits per retained VIN. Connect retention metrics directly to workshop revenue so you know which retention actions actually drive income.
Car Parc Exploration & Filtering
Filter your entire vehicle parc by age, model, or activity status. Use VIN exclusion logic to remove irrelevant entries and hand your team a clean, targeted list, ready for campaign activation with zero wasted outreach.
Aftersales Opportunity Detection
Spot revenue opportunities the moment they appear, customers overdue for service, low-visit segments, and high-value inactives. Turn every insight into a campaign that drives workshop traffic and increases spend per customer.
Actionable KPIs at a Glance
All critical metrics in one view: Retention %, car parc size, retained vs lost VINs, VTP, and visits per retained customer. Everything a manager or director needs to make a decision, no analyst required.
Built for Business Users
Intuitive layout with drill-down capability and interactive filters by country, brand, company, and vehicle age. No training, no IT dependency, your team is productive from day one.
From Data Discovery to a Validated Retention View
TechnoSignage manages the full implementation lifecycle, from data integration to dealer network training. Your team focuses on the insights. We handle everything else.
Connect
We integrate your dealer data sources, via manual upload, SFTP, or direct DMS connection, whichever fits your network.
Configure
Dashboard customised to your brand hierarchy, regional structure, KPI definitions, and user access tiers.
Launch
Users are onboarded, the first agreed data cycle is validated, and the solution moves into supported operation.
Data Integration
Excel / CSV templates submitted via web portal or email. Zero technical setup required on the dealer side.
Scheduled automated file delivery. Dealers drop files; the pipeline picks them up and processes automatically.
API connection into the Dealer Management System where supported, with validation and exception handling defined during implementation.
Dashboard & Hosting
Dashboard built to your brand hierarchy, regional structure, and KPI definitions from day one.
A managed-hosting option can cover infrastructure operations and the agreed pipeline refresh schedule.
Role-based access configured to your org structure. Users see exactly what they should from day one.
Dealer Network Onboarding
Structured training for dealer data coordinators covering upload procedures, data quality standards, and troubleshooting.
TechnoSignage walks each dealer through their first data submission, ensuring clean data from the start.
Dedicated helpdesk for network queries, data anomaly alerts, and pipeline issue resolution throughout the contract.
- Integration setup and pipeline testing
- Dashboard configuration and UAT
- User provisioning and access setup
- Dealer network training and first-cycle support
Frequently Asked Questions
See who you're losing. Win them back.
Show us how your service, vehicle, and dealer data is structured. We will map the retention questions, integration options, and a practical first release.