If your team downloads report attachments, renames files, uploads them, and rebuilds a reporting pack each morning, the dashboard is only the last part of the problem. Reliable daily analytics requires a repeatable data journey before anyone opens the report.
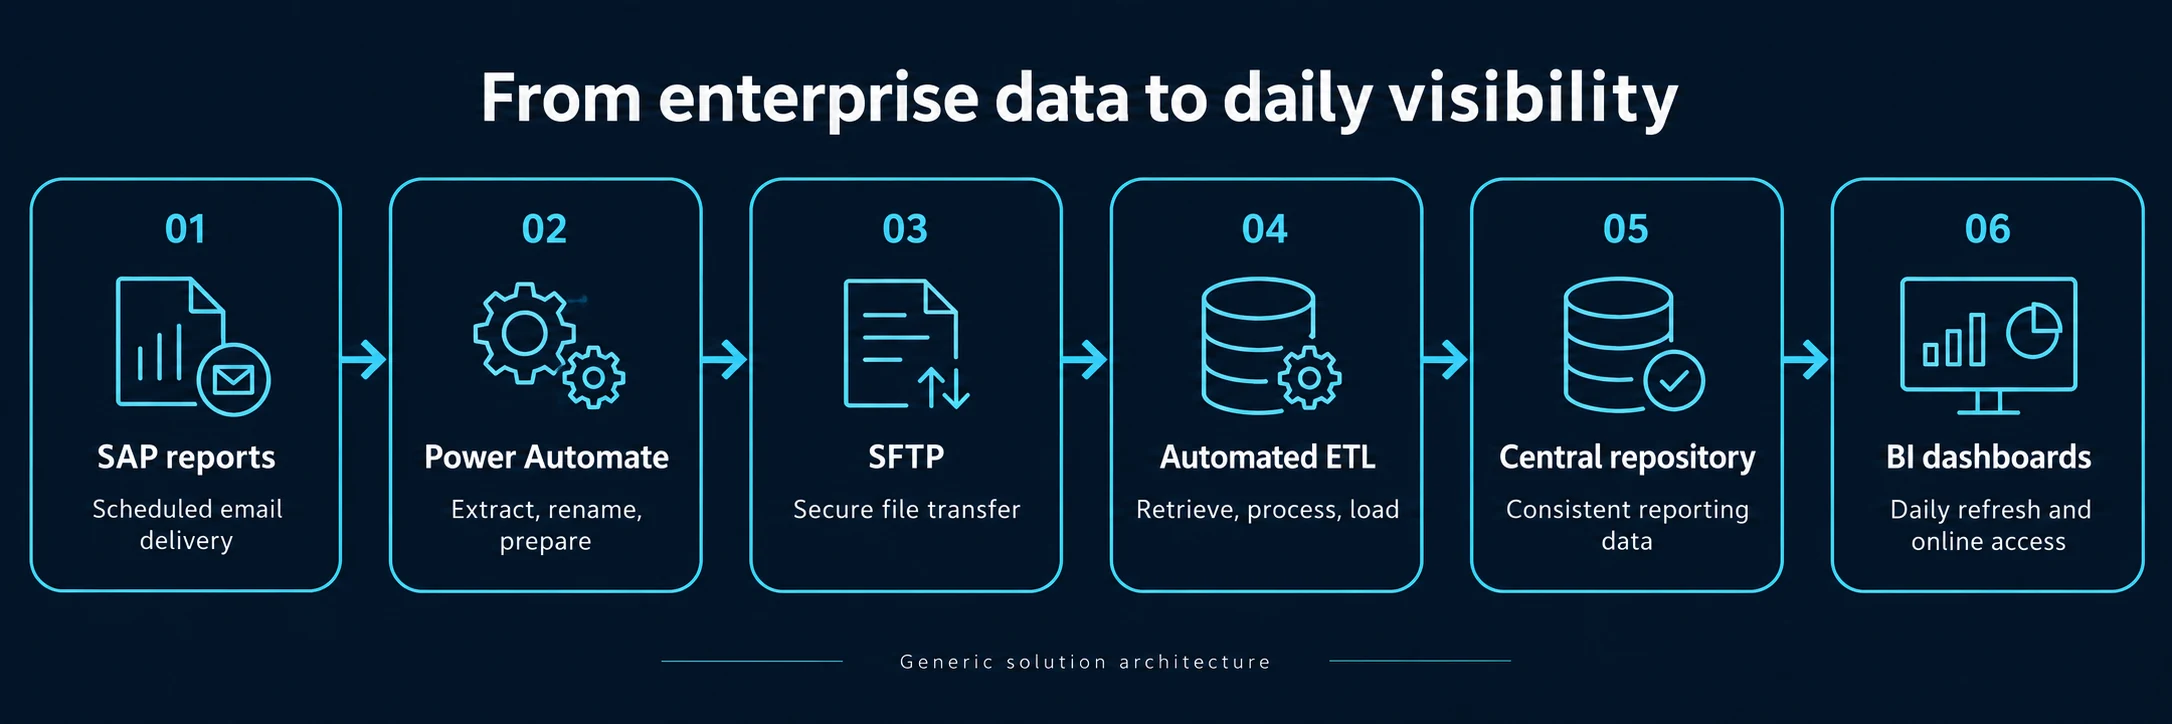
TechnoSignage's documented supply chain implementation connected scheduled SAP reports, Microsoft Power Automate, SFTP, automated ETL, and a central reporting environment for a major automotive manufacturer. The client is anonymised. The steps below explain that implementation and the scoping questions another organisation should ask before adopting a similar approach.
Start with the existing source and reporting cycle
The source in this project was enterprise-generated reports arriving as email attachments. Power Automate retrieved the attachments, renamed the files, and transferred them to SFTP for downstream processing. That addressed repeated collection and preparation tasks without requiring users to assemble the same files manually each day.
For a new project, first establish which reports are available, their arrival schedule, file format, and owner. Direct source access or an API may be appropriate in another environment. Choose the route after reviewing access and system constraints, rather than assuming email exports are always the answer.
Make the handoff between collection and ETL explicit
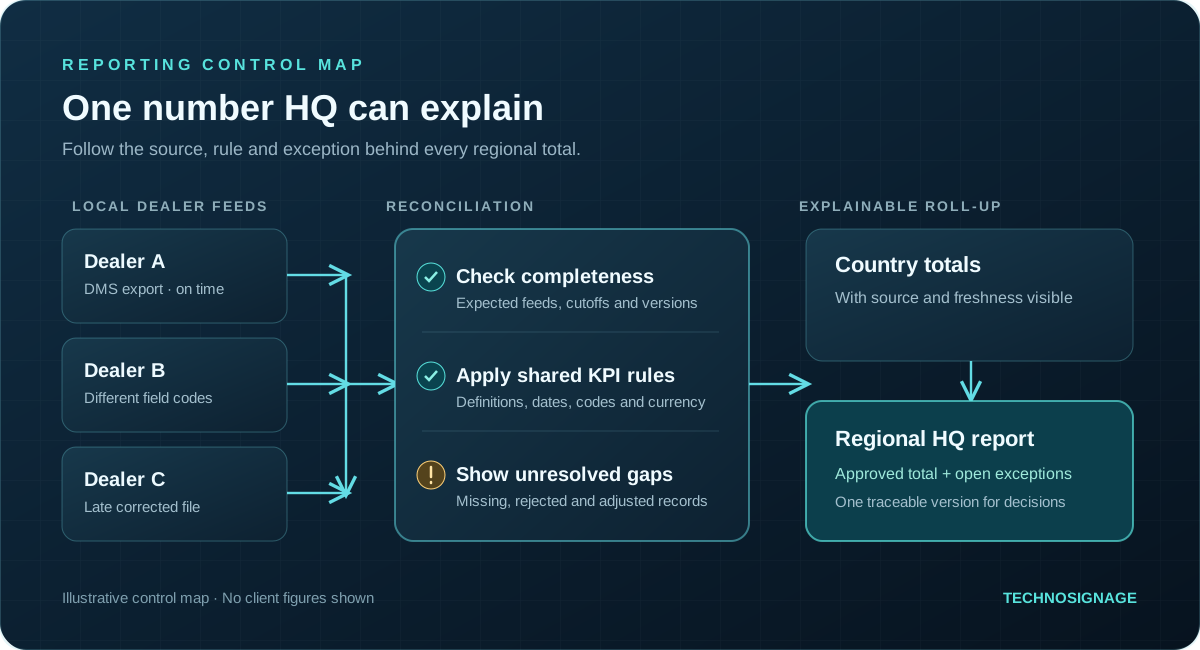
A transferred file is not yet reporting-ready data. The ETL stage prepares source data for a common model and central repository. During discovery, agree expected file structures, required fields, naming conventions, and how the reporting process will handle missing, duplicate, or changed files.
These are controls to specify for your own project, not a claim that every possible exception was implemented in the published case study. Ask the delivery team to document which checks are included and how users will learn that a refresh is incomplete.
Model the operating questions before designing charts
The delivered supply chain views cover order intake, warehouse pick and pack, pre-invoiced orders, invoiced orders awaiting shipment, backorder ageing, and future orders. Those views follow the order lifecycle, so the reporting design reflects the work users need to review.
In your organisation, agree which statuses belong in each measure, what the reporting cut-off means, and whether the same order can appear in multiple views. Business owners should validate the model against representative source reports before the output becomes a management reference.
Define freshness in terms users can understand
The documented implementation refreshes dashboards daily. Daily reporting should not be described as real-time visibility. A user needs to know which reporting period and latest successful data load the dashboard represents.
Set the refresh requirement from the decision. Some management reviews can use daily snapshots; other operating workflows may need a different schedule. Availability of source data, processing time, and support arrangements shape what is practical.
Agree operating ownership after go-live
A repeatable pipeline still needs ownership. Agree who checks failed loads, handles source changes, approves KPI updates, and manages user access. Include instructions for investigation and recovery in the handover, and make the support scope visible in the proposal.
Automating collection can remove recurring manual steps. It does not by itself establish a measured time-saving percentage. If you want to quantify the result, record the original preparation effort, processing failures, and reporting delay, then compare the same measures after deployment over an agreed period.
What to bring to a reporting automation discussion
- A sample report with sensitive information removed.
- The reporting cycle and decisions it supports.
- A list of source systems and available access methods.
- The manual preparation steps and known exceptions.
- The business owner who can validate definitions and totals.
- Your users, permission needs, and support expectations.
Read the full supply chain case study for the delivered architecture. Our data analytics and BI consulting connects source preparation with usable reporting. To scope a similar requirement, tell us which report takes too long to prepare.